
The PDC Explorer is an interactive data visualization tool designed to facilitate metadata and data discovery. This tool provides an intuitive search interface, with a variety of combinable search filters, as well as map and table perspectives designed to meet searcher preferences. Search results have direct links to corresponding PDC metadata records for quick tracking to the respective authoritative sources. All search results are exportable to CSV files, for easy porting to other workflows and tools. This PDC Explorer is available in both English and French languages. Note your browser may require time to load the visualization. Additional resources can also be downloaded below, including documentation and developer resources.
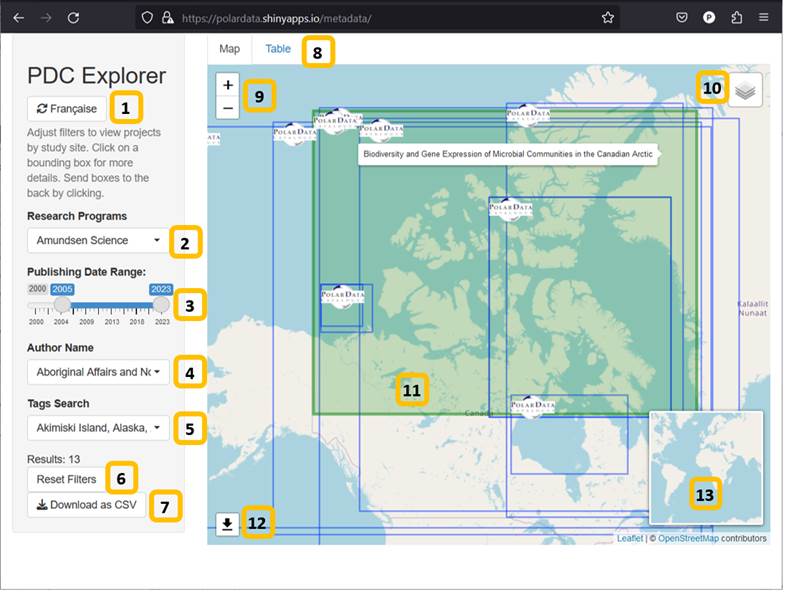
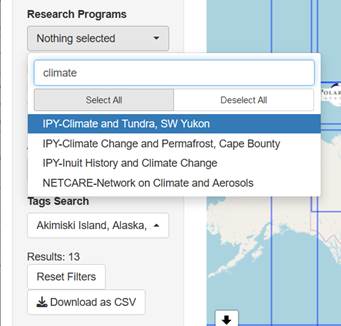
Click on the research program filter. To search, click in the text box at the top of the filter and type in your search term. Click each result to add it to the map. If you have extra programs in your results that you want to remove, clear the text box then click the "Deselect All" option to clear all the programs. Then type your search term again. Note that if the program name in the filter dropdown doesn't have a check mark on it, it will not show in the map.
Both the author filter and the tags filter have all items selected by default, and also when the "Reset Filters" button is pressed. To search on author or tags, it might be best to ensure all research programs are also selected. To do this, click on the research program filter and click the "Select All" button. Then you can filter by author name or by tags. You may wish to click "Deselect All" in the author or tags filter, to ensure that you're only filtering by the author or tags you're interested in.
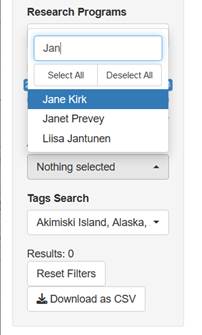
Example Step 1: Click "Deselect All" to clear the author filter before searching.
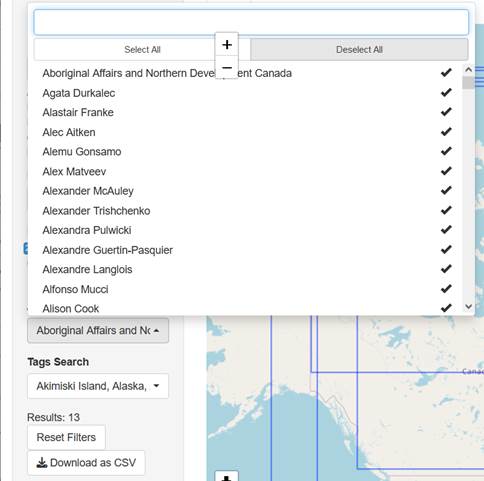
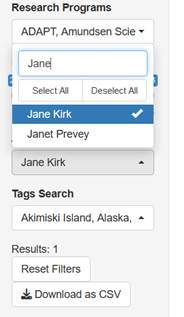
Example Step 2: Search author by name. Note that the Results are 0 unless an author name is clicked on.
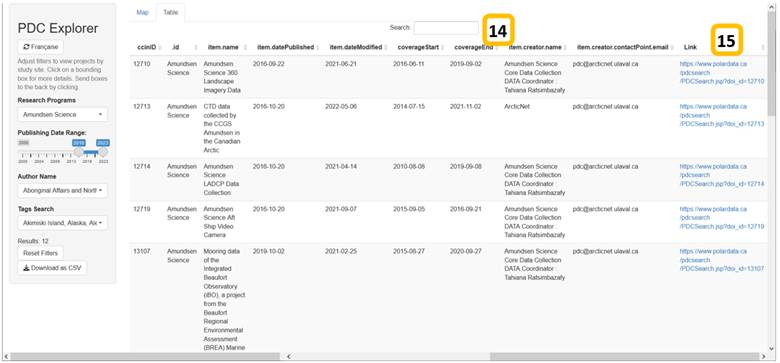
Currently, data is only available on the Polar Data Catalogue website, so it can't be downloaded directly from the PDC Explorer visualization. The good news is that the Explorer has direct links to the PDC website for every research program. There are two main ways to locate these links, popups on the map and the table view.
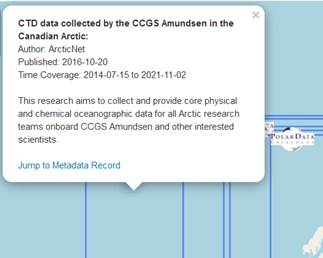
On the map, if you click on any research program rectangle, a popup appears with information about that research program. At the bottom of the popup is a link to the metadata record on the Polar Data Catalogue website where, if it is available, data can be downloaded.
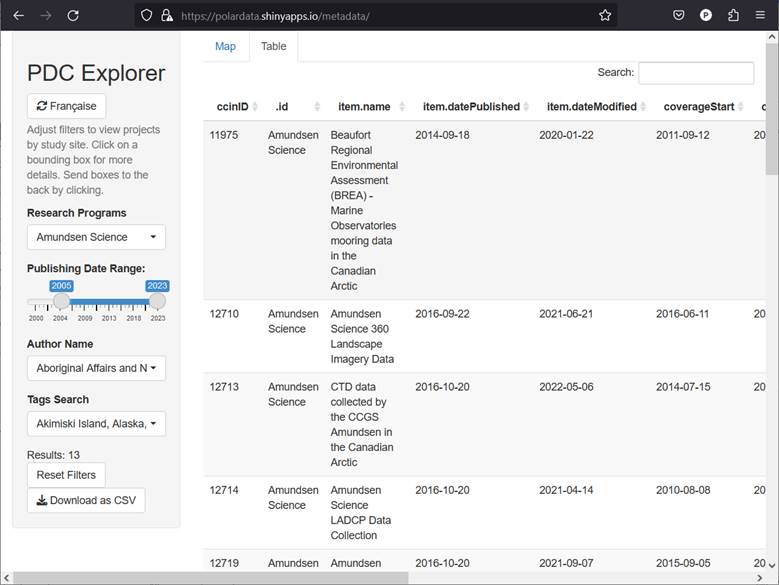
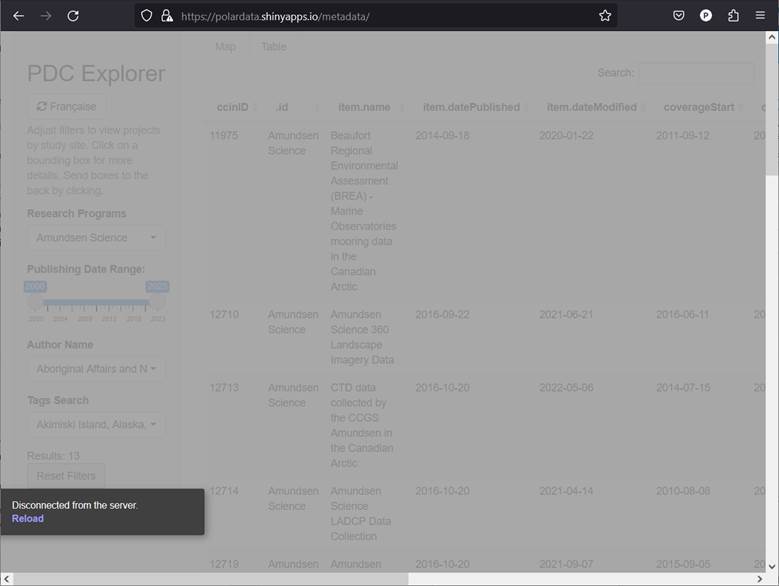
On the table, links to each metadata record are found on the far right side of the table. Depending on your device, you may need to scroll the screen to the far right to see these links.
If the visualization sits idle for long enough, it will disconnect and show a grey screen. You can click on the "Reload" link or refresh your browser to reconnect to the web application. Your filter may reset, so be sure to save any results before halting use of the visualization.
Available downloads include the Guide for using the PDC Explorer, a Cookbook for developers, and an Archive that contains visualization source code and associated resources. The visualization source code demonstrates a variety of programmatic implementations including: 1) API invocation and metadata harvest; 2) manipulation of API responses for data structure population; 3) traversal and manipulation of in-memory data structures; 4) creation of interactive maps using Leaflet and the Shiny web application publishing framework; 5) data export functionality; 6) general visualization design and implementation, including bilingual support. The source code is annotated with helpful comments relating to extensibility, as well as potential caveats. The associated source code assets also include required resource files, such as the JSON file of translations needed to implement the bilingual functionality.
CoreTrustSeal Certified Repository

CCIN provides research data management services and infrastructure for the Canadian Arctic and Antarctic research and monitoring communities.
CCIN/PDCFirefox 115, Google Chrome 119, Opera 101, Microsoft Edge 119, and Safari 16
The PDC website and applications may not be available during the daily maintenance window from 9:00pm to 11:00pm Eastern Standard Time (UTC-5:00) / Eastern Daylight Time (UTC-4:00).
Version 2.6: Released February 2026

![]() 2026
Polar Data Catalogue @ Canadian Cryospheric Information Network
2026
Polar Data Catalogue @ Canadian Cryospheric Information Network