Table of Contents
List of Tables
1.1 2003 Gulf of St. Lawrence SAR Validation Field Program
Objective: Collect field-validated SAR datasets within the marginal ice zone to advance our understanding of multi-polarimetric SAR signatures
2003 was the inaugural year for this potential multi-year project. There is an intention to visit the same area in 2004 and complete a similar type of program. Field activities were based out of Charlottetown and Figure 2.1 in Section 2 represents national and regional scales of the project study area. The duration of the project was 9 days, from February 27th (Day 058) to March 7th (Day 066), and involved 6 field personnel from five agencies.
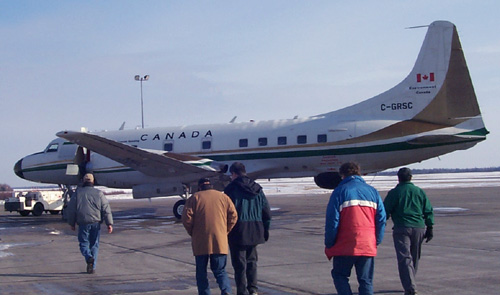
The two principal data types collected during the project were remotely sensed and surface/helicopter sampling data. Remotely sensed data was acquired in real time on board the CV-580 aircraft while other satellite data sets were accumulated at the Canadian Ice Service (CIS) through their data acquisition infrastructure. Some of these satellite data were transferred to the field personnel on a best effort basis and used in their site/feature validation studies. Surface and helicopter sampling was conducted at each of the sites visited during the helicopter surveys on March 1st, 2nd and 6th.
| Group | Personnel | Field Activities |
|---|---|---|
| Canadian Ice Service, MSC Environment Canada | Ken Asmus | Feature validation in ENVISAT and CV-580 Data |
| Canadian Ice Service, MSC Environment Canada | Dan Fequet | Feature validation in ENVISAT and CV-580 Data |
| Bedford Institute of Oceanography | Simon Prinsenburg |
1.2 Report Summary
The 2003 ENVISAT Validation Data report is a reference document for all the remotely sensed, field, and other pertinent data collected during the field campaign. Section 3 outlines the types of remotely sensed data collected for the validation project and provides sensor descriptions, dates of acquisition, and data formats for all imagery. Section 4 contains information on the various types of ice charts from different sources describing the ice conditions during the experiment. Section 5 is an overview of all the data collected on the ice or from helicopter, either by physical measurement or from digital photography. The data report concludes with Appendix A, detailed CV-580 flight logs; Appendix B, Surface/Helicopter sampling spreadsheet; Appendix C, sampling flight path maps; Appendix D, BIO report; and Appendix E, breakdown on a per day basis of all data collected during the project.
NB. Please note that the times of all data in tables are in GMT (Z). To convert to local time (Atlantic Standard Time), subtract 4 hours from the GMT time listed.
Back to Table of Contents